Eric Douglas Pratt
MOTOACTV Fitness Portal for Motorola
2011
My first assignment at Isobar was to join the team feverishly working up to the launch of Motorola's first fitness-tracking smartwatch, MOTOACTV. While Motorola engineers polished off the watch's operating system, Isobar worked alongside them developing the companion web portal and Android app.
I was in heaven. Coming from the business software world and a project limited mostly to CSS work in a proprietary development environment, this hit all my goals of working on a JavaScript-heavy consumer product for a well-known brand with a collaborative team of talented engineers and designers. As a runner, it was even in line with my own fitness goals and I regularly tested the smartwatch out on my own runs.
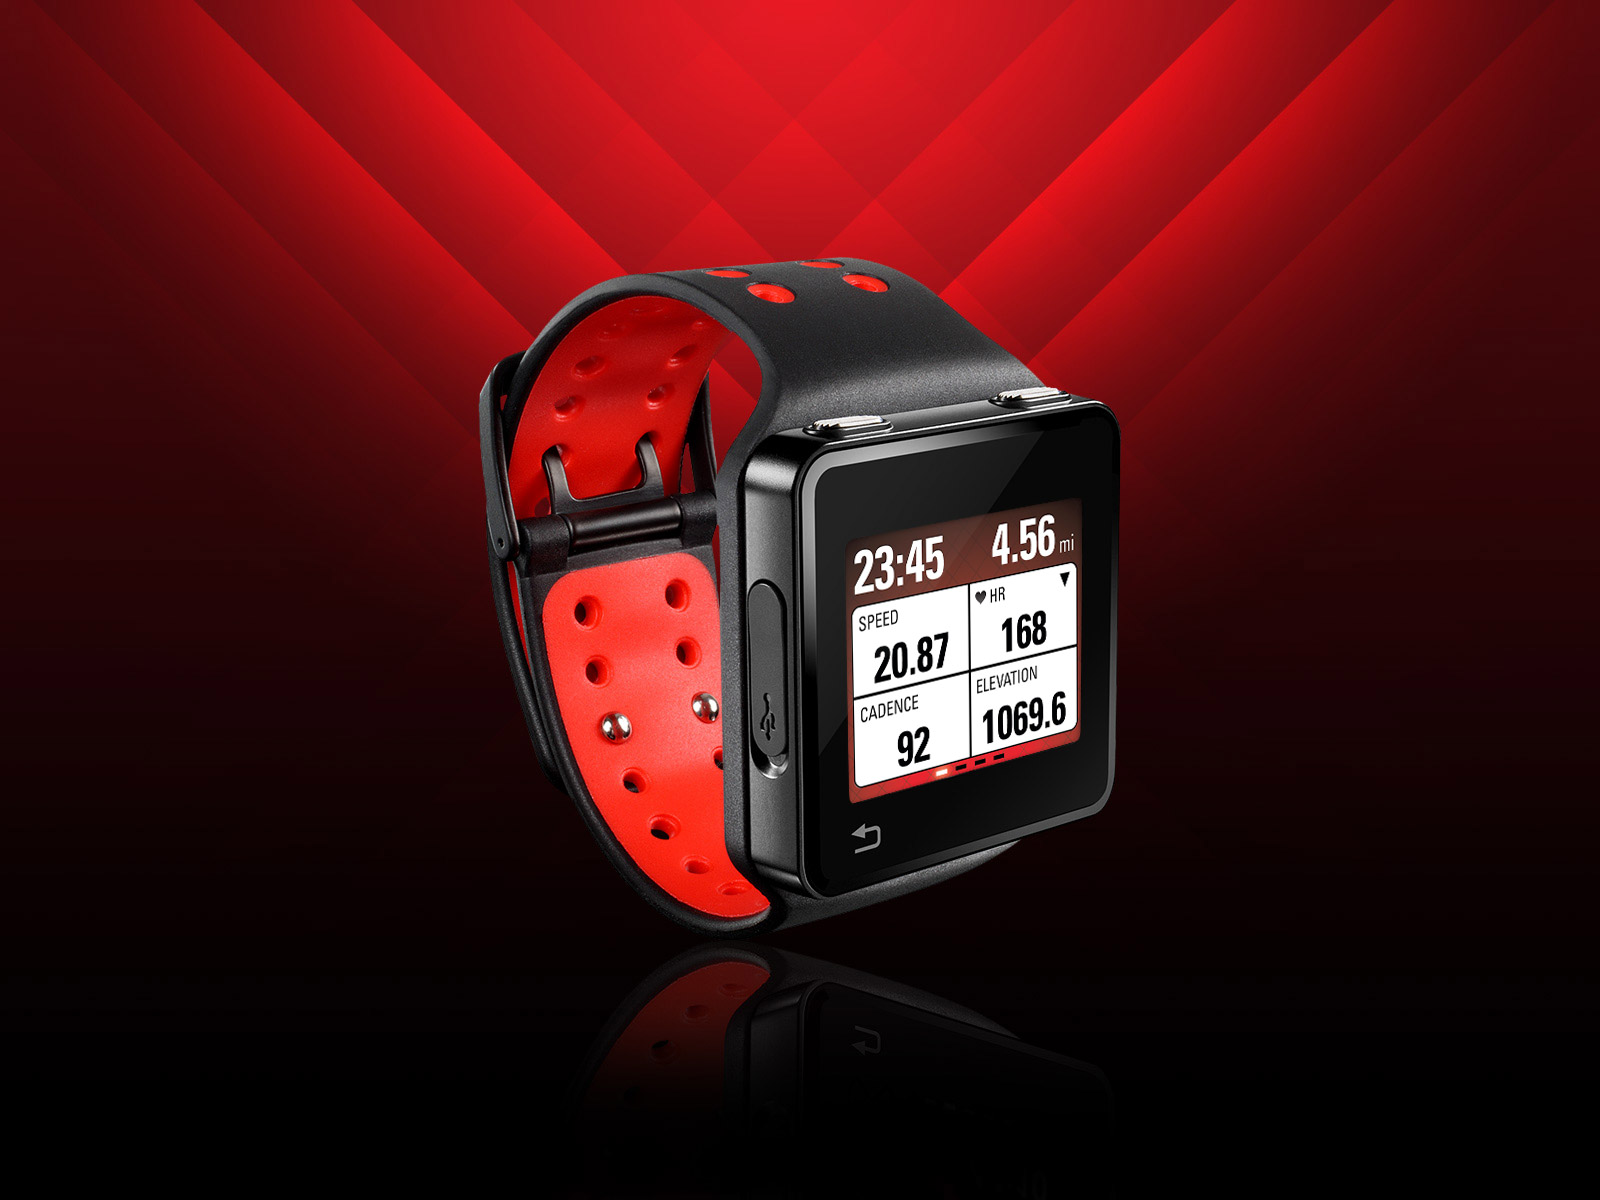
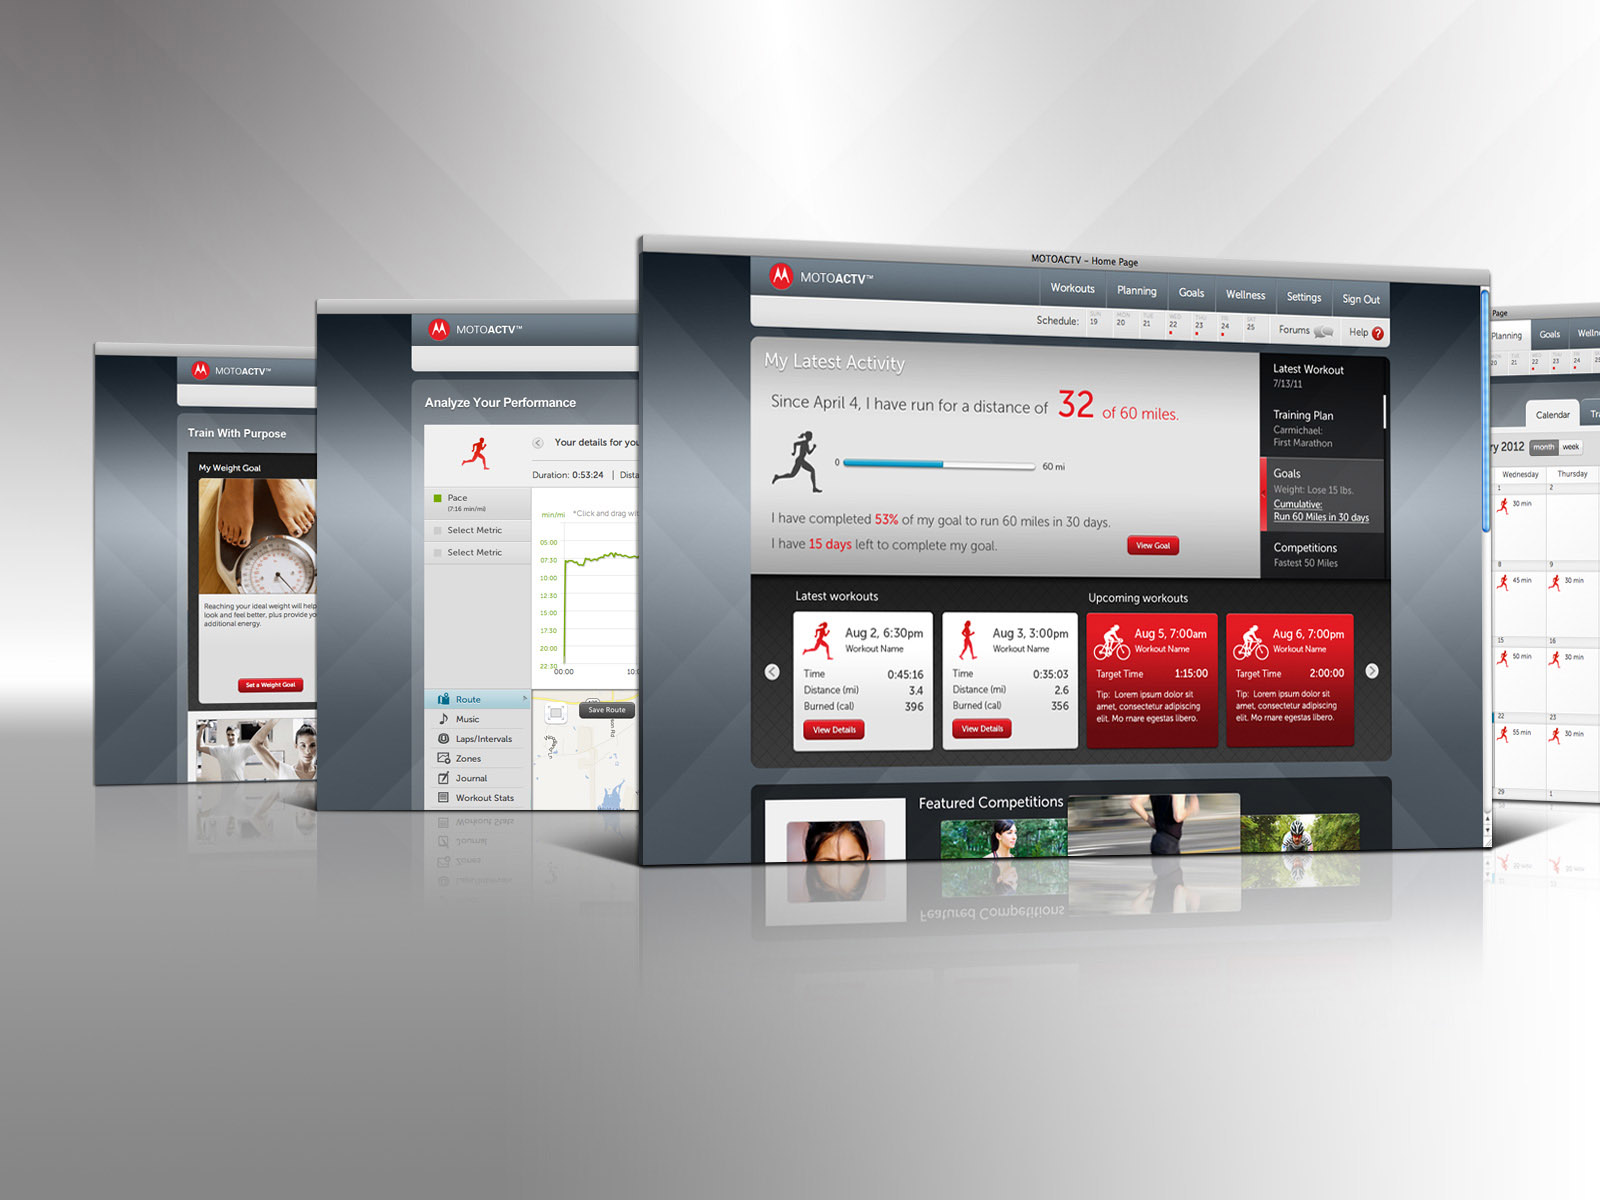
MOTOACTV had exercise tracking capabilities for many types of workouts and generated a wealth of data you could visualize later on the web portal. Like most gadgets back then, you needed to connect it via cable to your computer to sync data to the server.
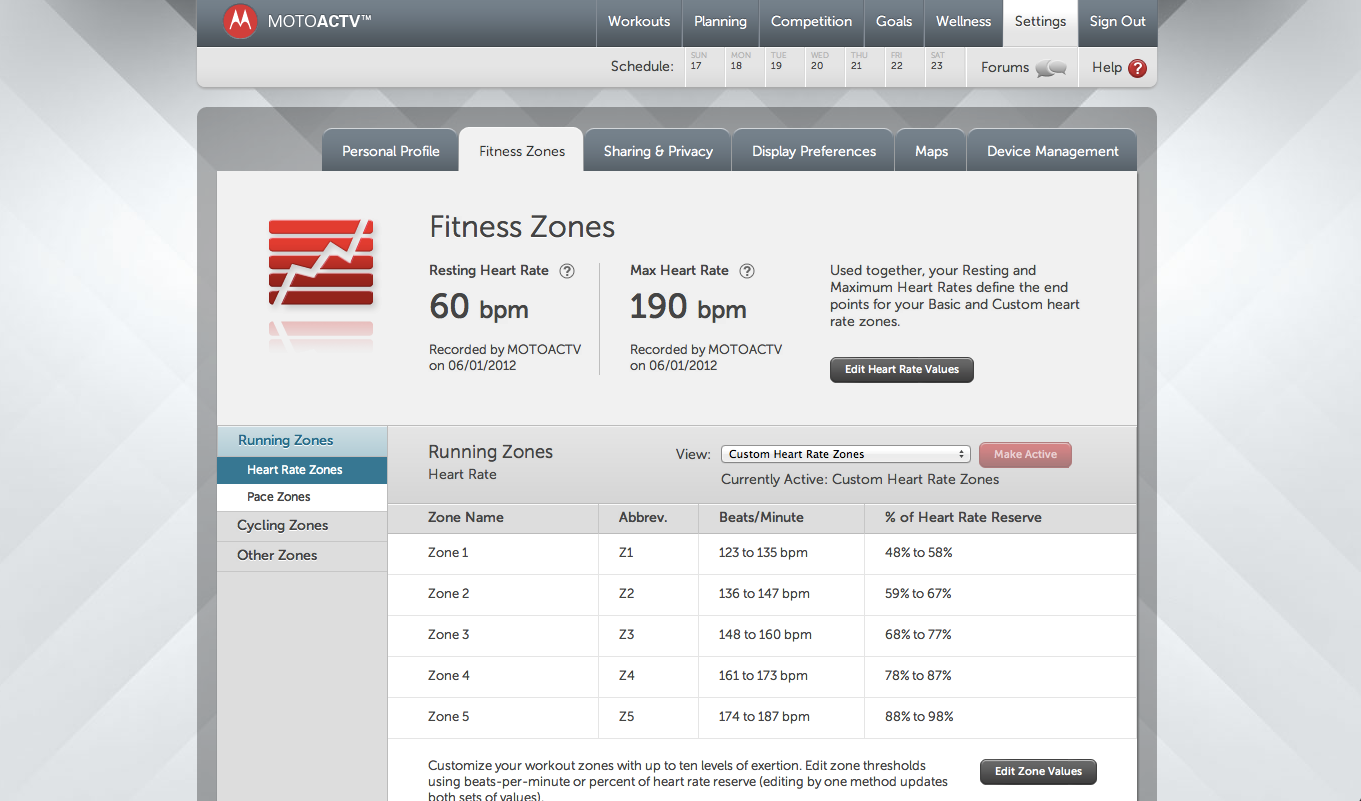
The site used jQuery, Google Maps, and Highcharts to power its interactive functions. I worked on nearly all of the site's features, including the homepage, map visualization, planning calendar, goal setting, community competitions, fitness zones, and more.
After the product launched in October 2011, our team continued to work with Motorola engineers to add new features. Two of the more unique features at the time were shot tracking for golf games (complete with arcs of each shot visible on a map) and sleep analysis (never released due to the MOTOACTV being discontinued).
Overall, the MOTOACTV project was a joy to work on and a perfect way to deepen my JavaScript expertise while building a fun and extremely capable product.